Optimizing Navigation for Higher Conversion: An IA Redesign
- Stakeholder workshop
- GA4 analytics
- Competitive benchmarking
- Open card sorting
- Information architecture redesign
The Brief
The business had a conversion problem. Users were landing on the website but not reaching the content and services that mattered most. The navigation had grown organically over time, and no one had stepped back to ask whether the structure still matched how users actually think and what they actually need.
My job was to lead the end-to-end process: diagnose the problem, align the organization around a direction, and design a new information architecture that would reduce friction and surface high-value content.
The Starting Point: A Workshop That Said Everything
Rather than starting with data or competitive research, I chose to open with a cross-functional stakeholder workshop.
The workshop brought together multiple teams and was anchored around the four personas that drive the most business value: Authors, Librarians, Medical Affairs, and Societies.
The session ran in two parts. In the first, we conducted a target audience analysis. I asked stakeholders to answer three questions for each persona: Why does this person visit the website? What does Karger currently offer them? And what do we want them to discover or do? To keep the output actionable, I asked each group to distill their answers into a single sentence per question, a discipline that forced clarity and gave me a set of audience job-to-be-done statements to guide the redesign.
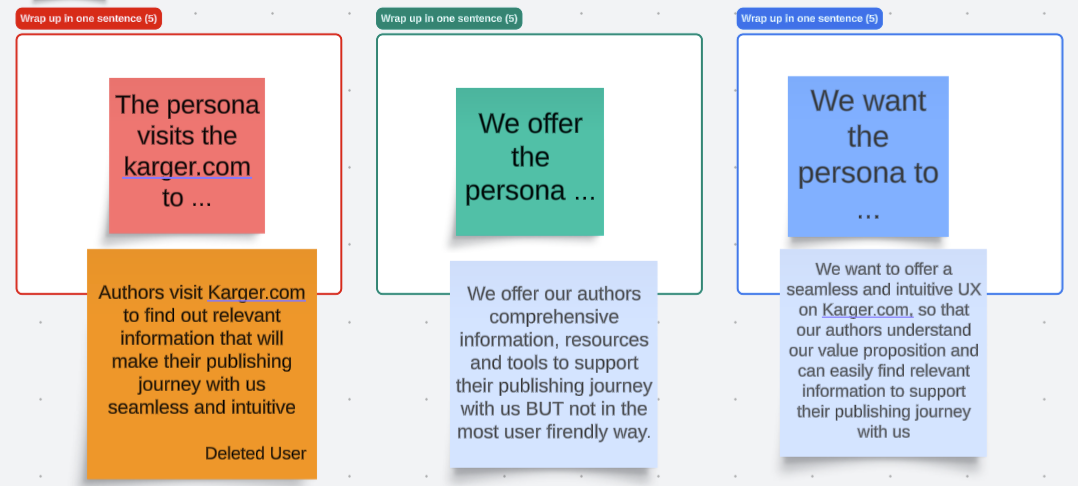
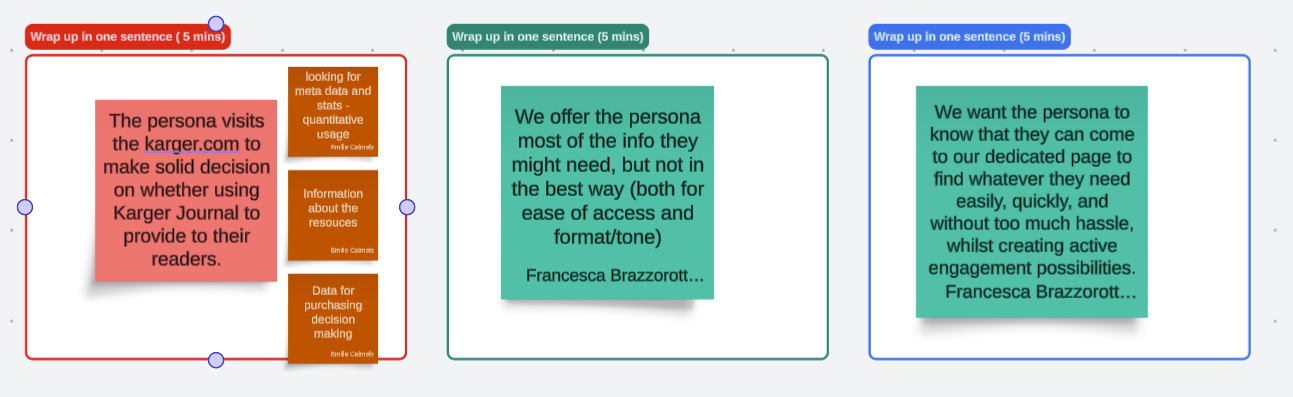
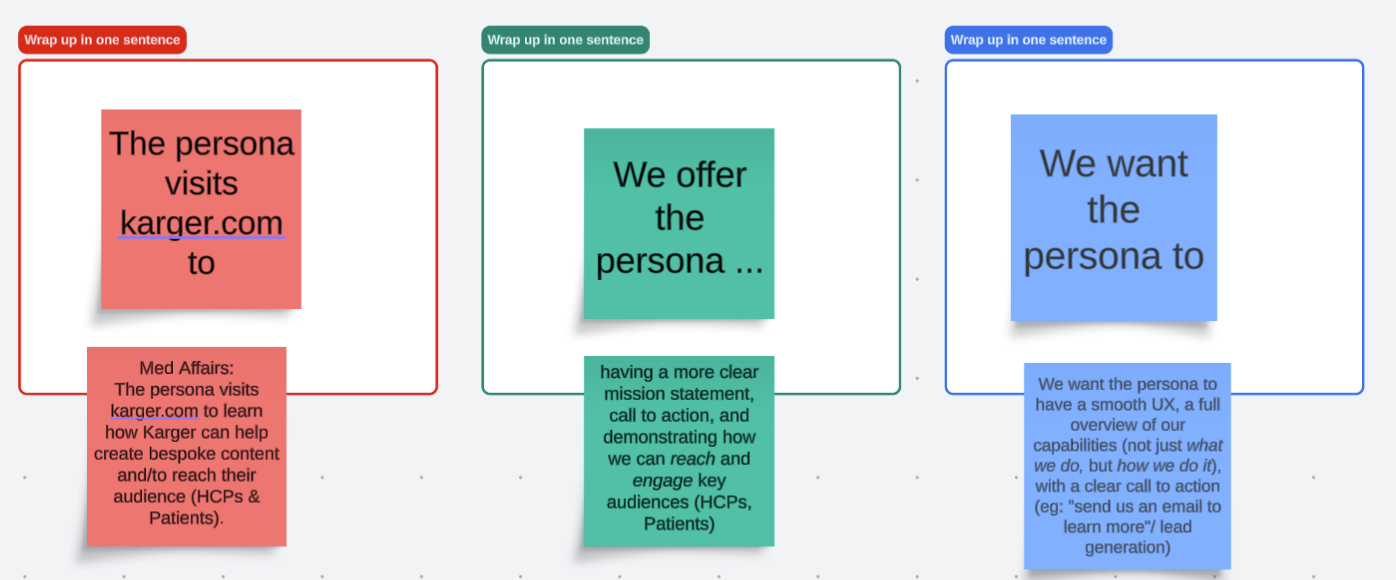
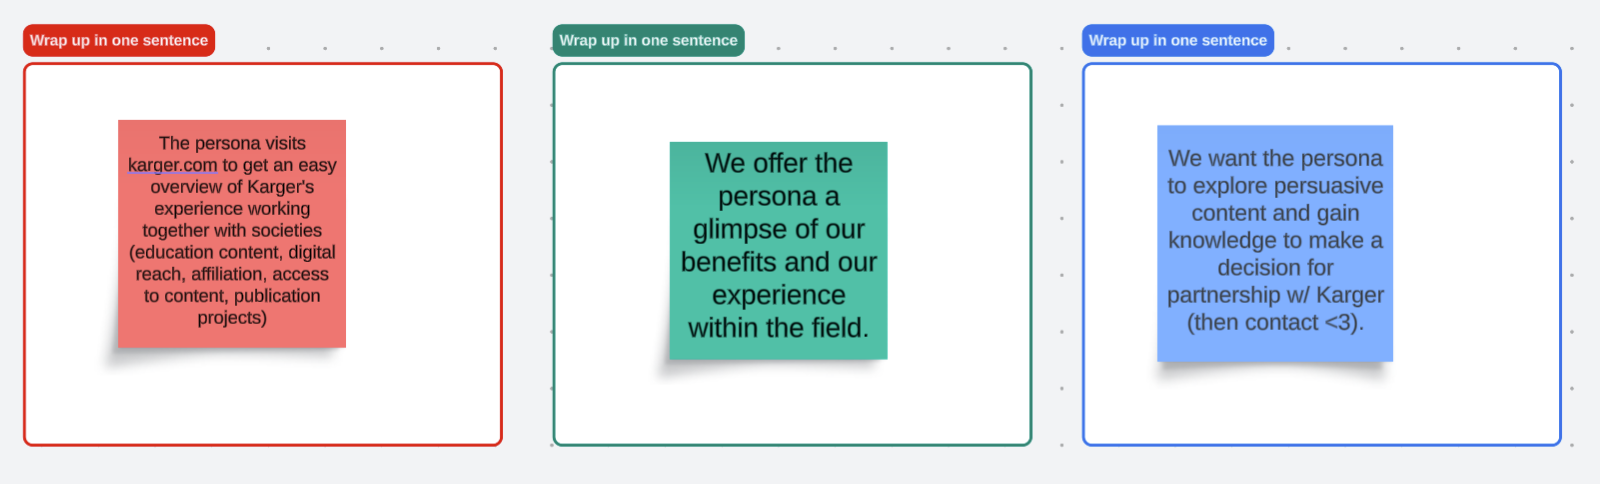
In the second part, a representative for each audience was asked to validate the existing user flow. Every group independently reached the same conclusion: the information architecture was cluttered and unclear.
This convergence did two things. It validated that the problem was real and widely felt, not a matter of taste. And it created immediate organizational alignment around the need for change, giving the redesign genuine momentum from day one.
The workshop produced three clear directives: flatten the sitemap, prioritize high-interest content, and reduce the number of clicks required to reach key pages.
Step 1: Letting the Data Tell the Story
With stakeholder alignment secured, I moved into GA4 to pressure-test our assumptions with behavioral data. The goal was to understand which parts of the navigation users actually engaged with, and which were essentially invisible, cross-checking our workshop findings with quantitative evidence.
Four patterns emerged.
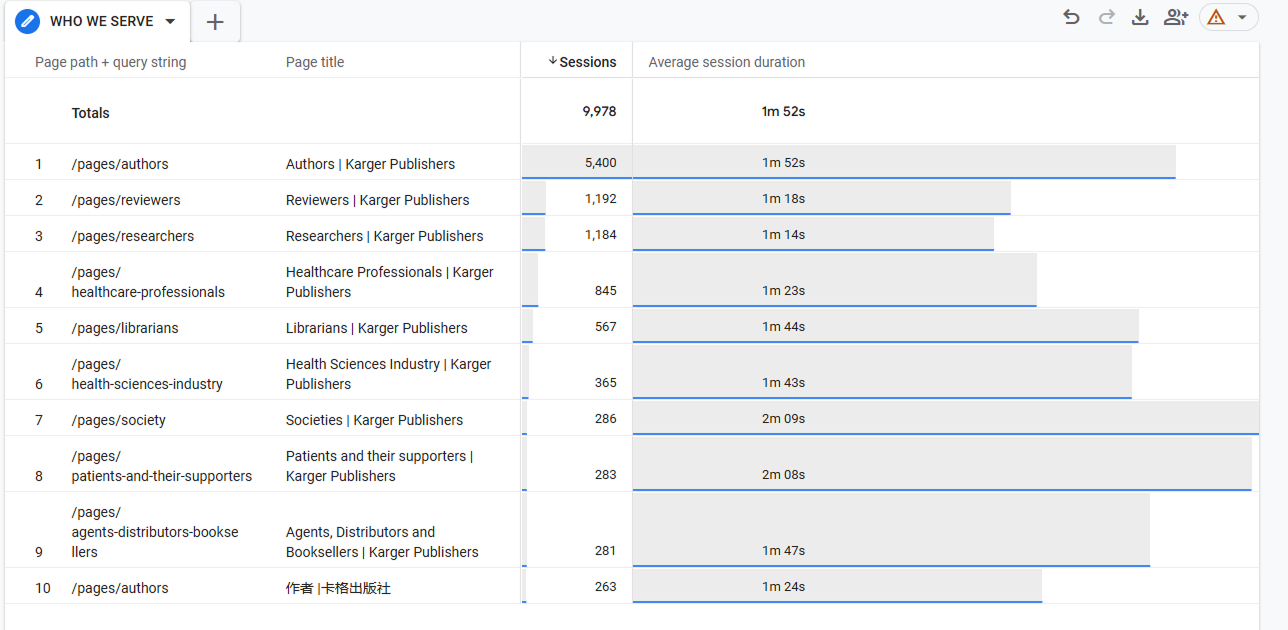
- Under "Who We Serve," authors dominated traffic, while other audience segments were being significantly underserved by the current structure.
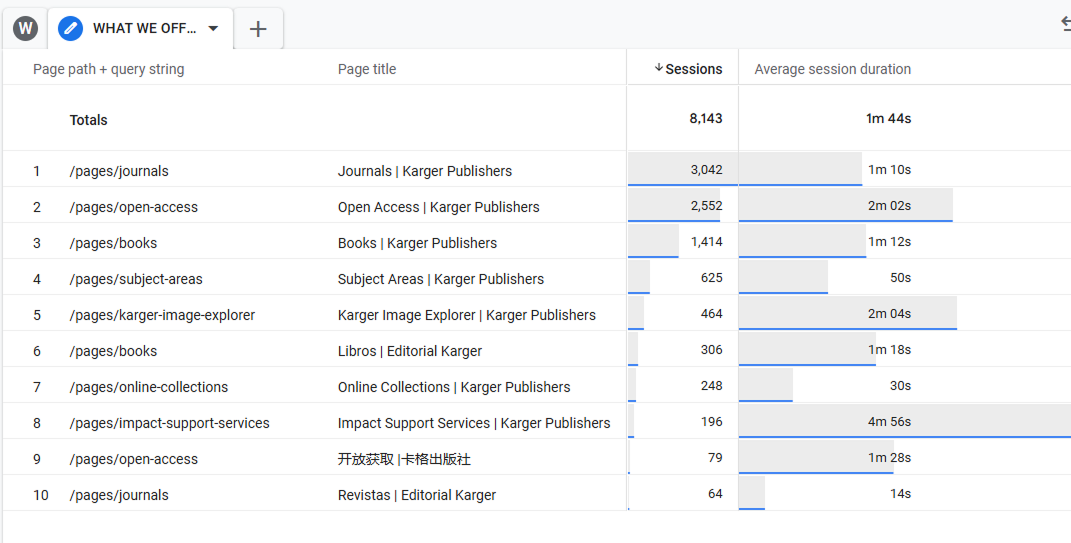
- Under "What We Offer," traffic was heavily concentrated on journals and open access, while more specialized services had almost no visibility despite being genuinely valuable.
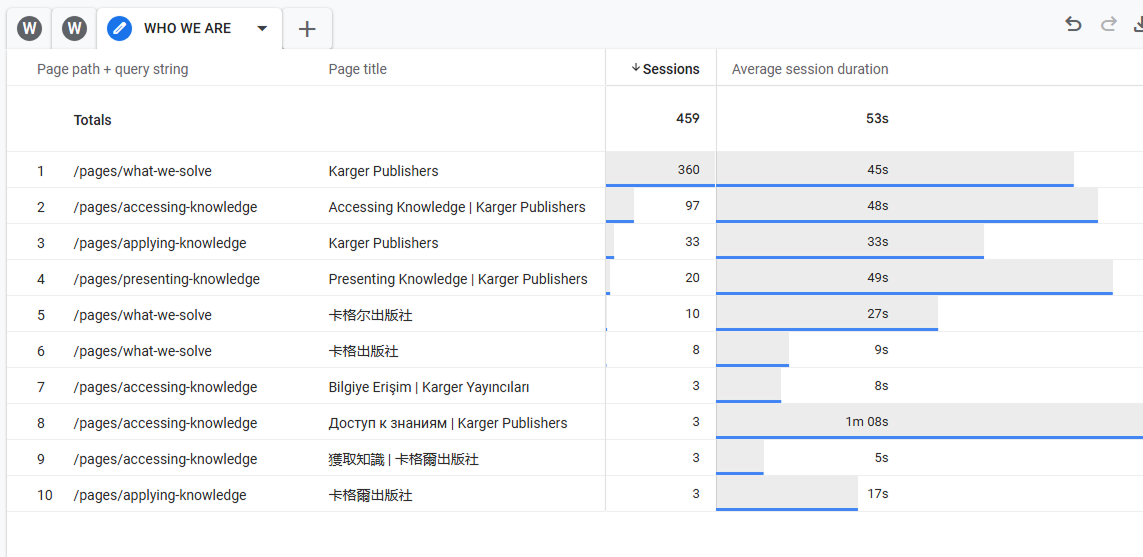
- Across the "Who We Are" section, engagement was weak throughout. The company's own story simply wasn't landing.
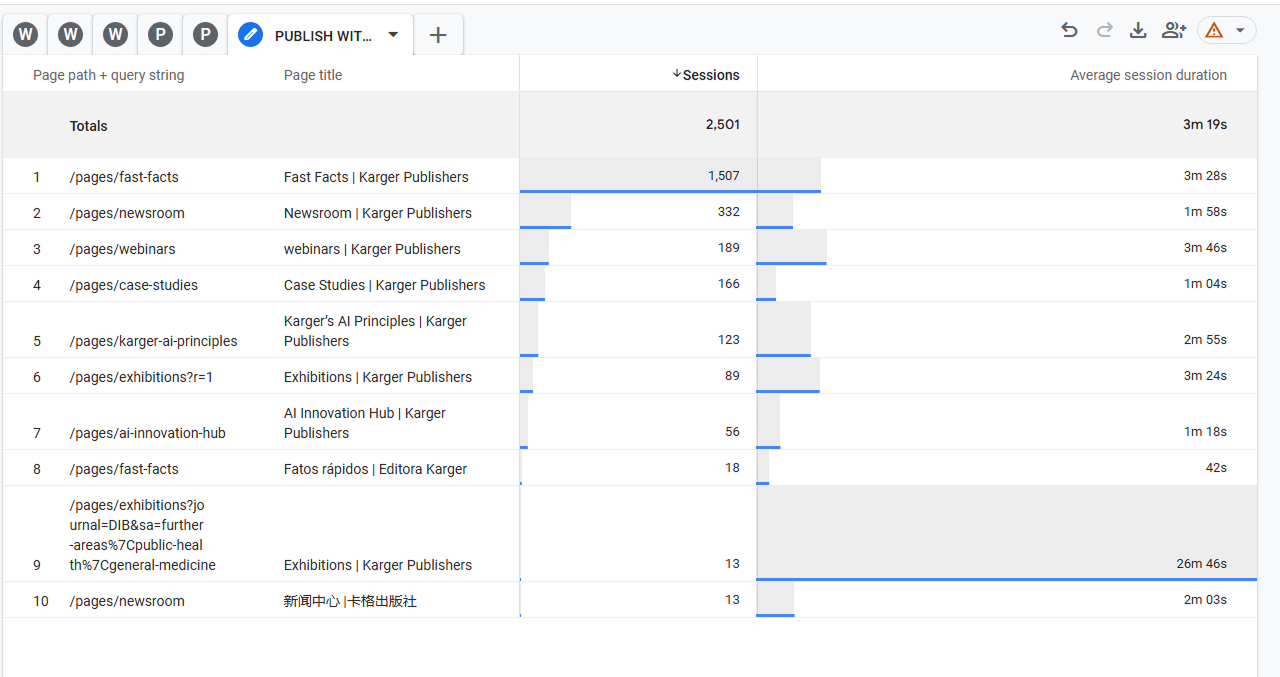
- Under "Resources for You," Fast Facts was by far the most visited section, with the remaining pages functioning almost as dead ends.
Together, these patterns confirmed what the workshop had surfaced qualitatively: the navigation wasn't directing users toward the right content, and large parts of the site were invisible in practice even if they existed in the menu.
Step 2: Benchmarking Against Competitors
To move from diagnosis to design direction, I conducted a structured competitive analysis across four major publishers: Elsevier, Springer Nature, Frontiers, and Wiley Online Library. I evaluated each across eight dimensions including global navigation focus, search architecture, audience hubs, submission paths, and accessibility.
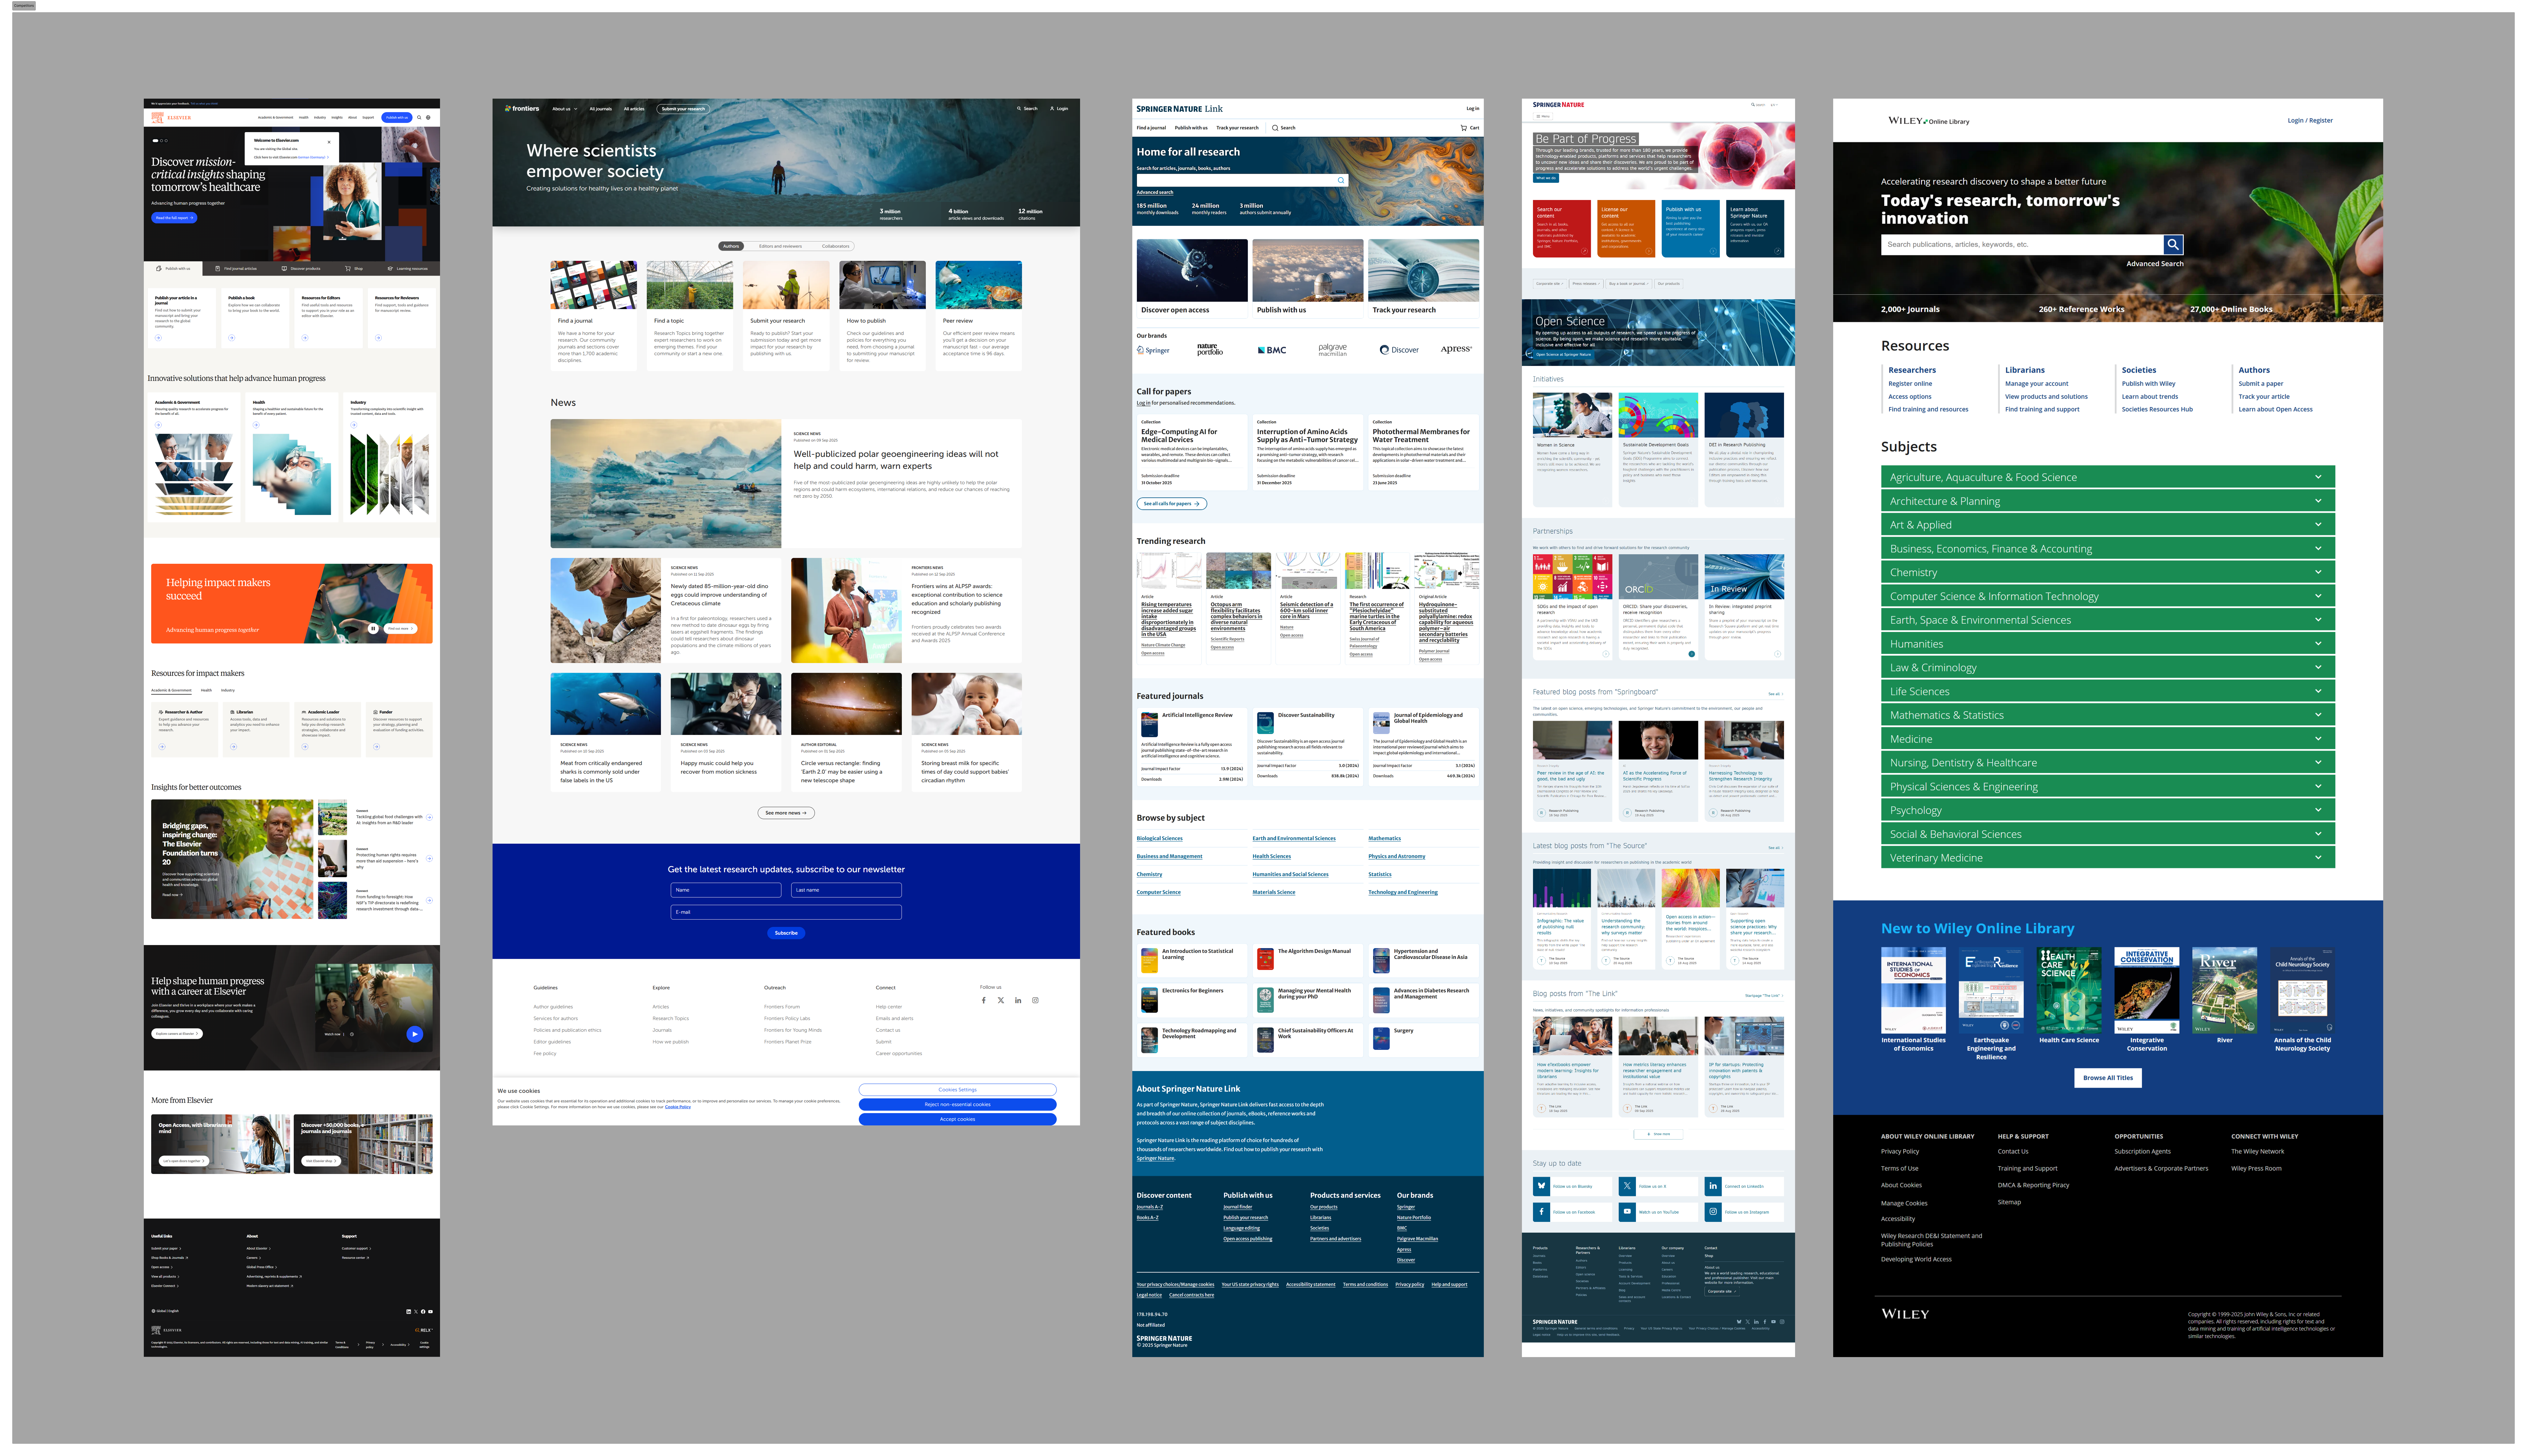
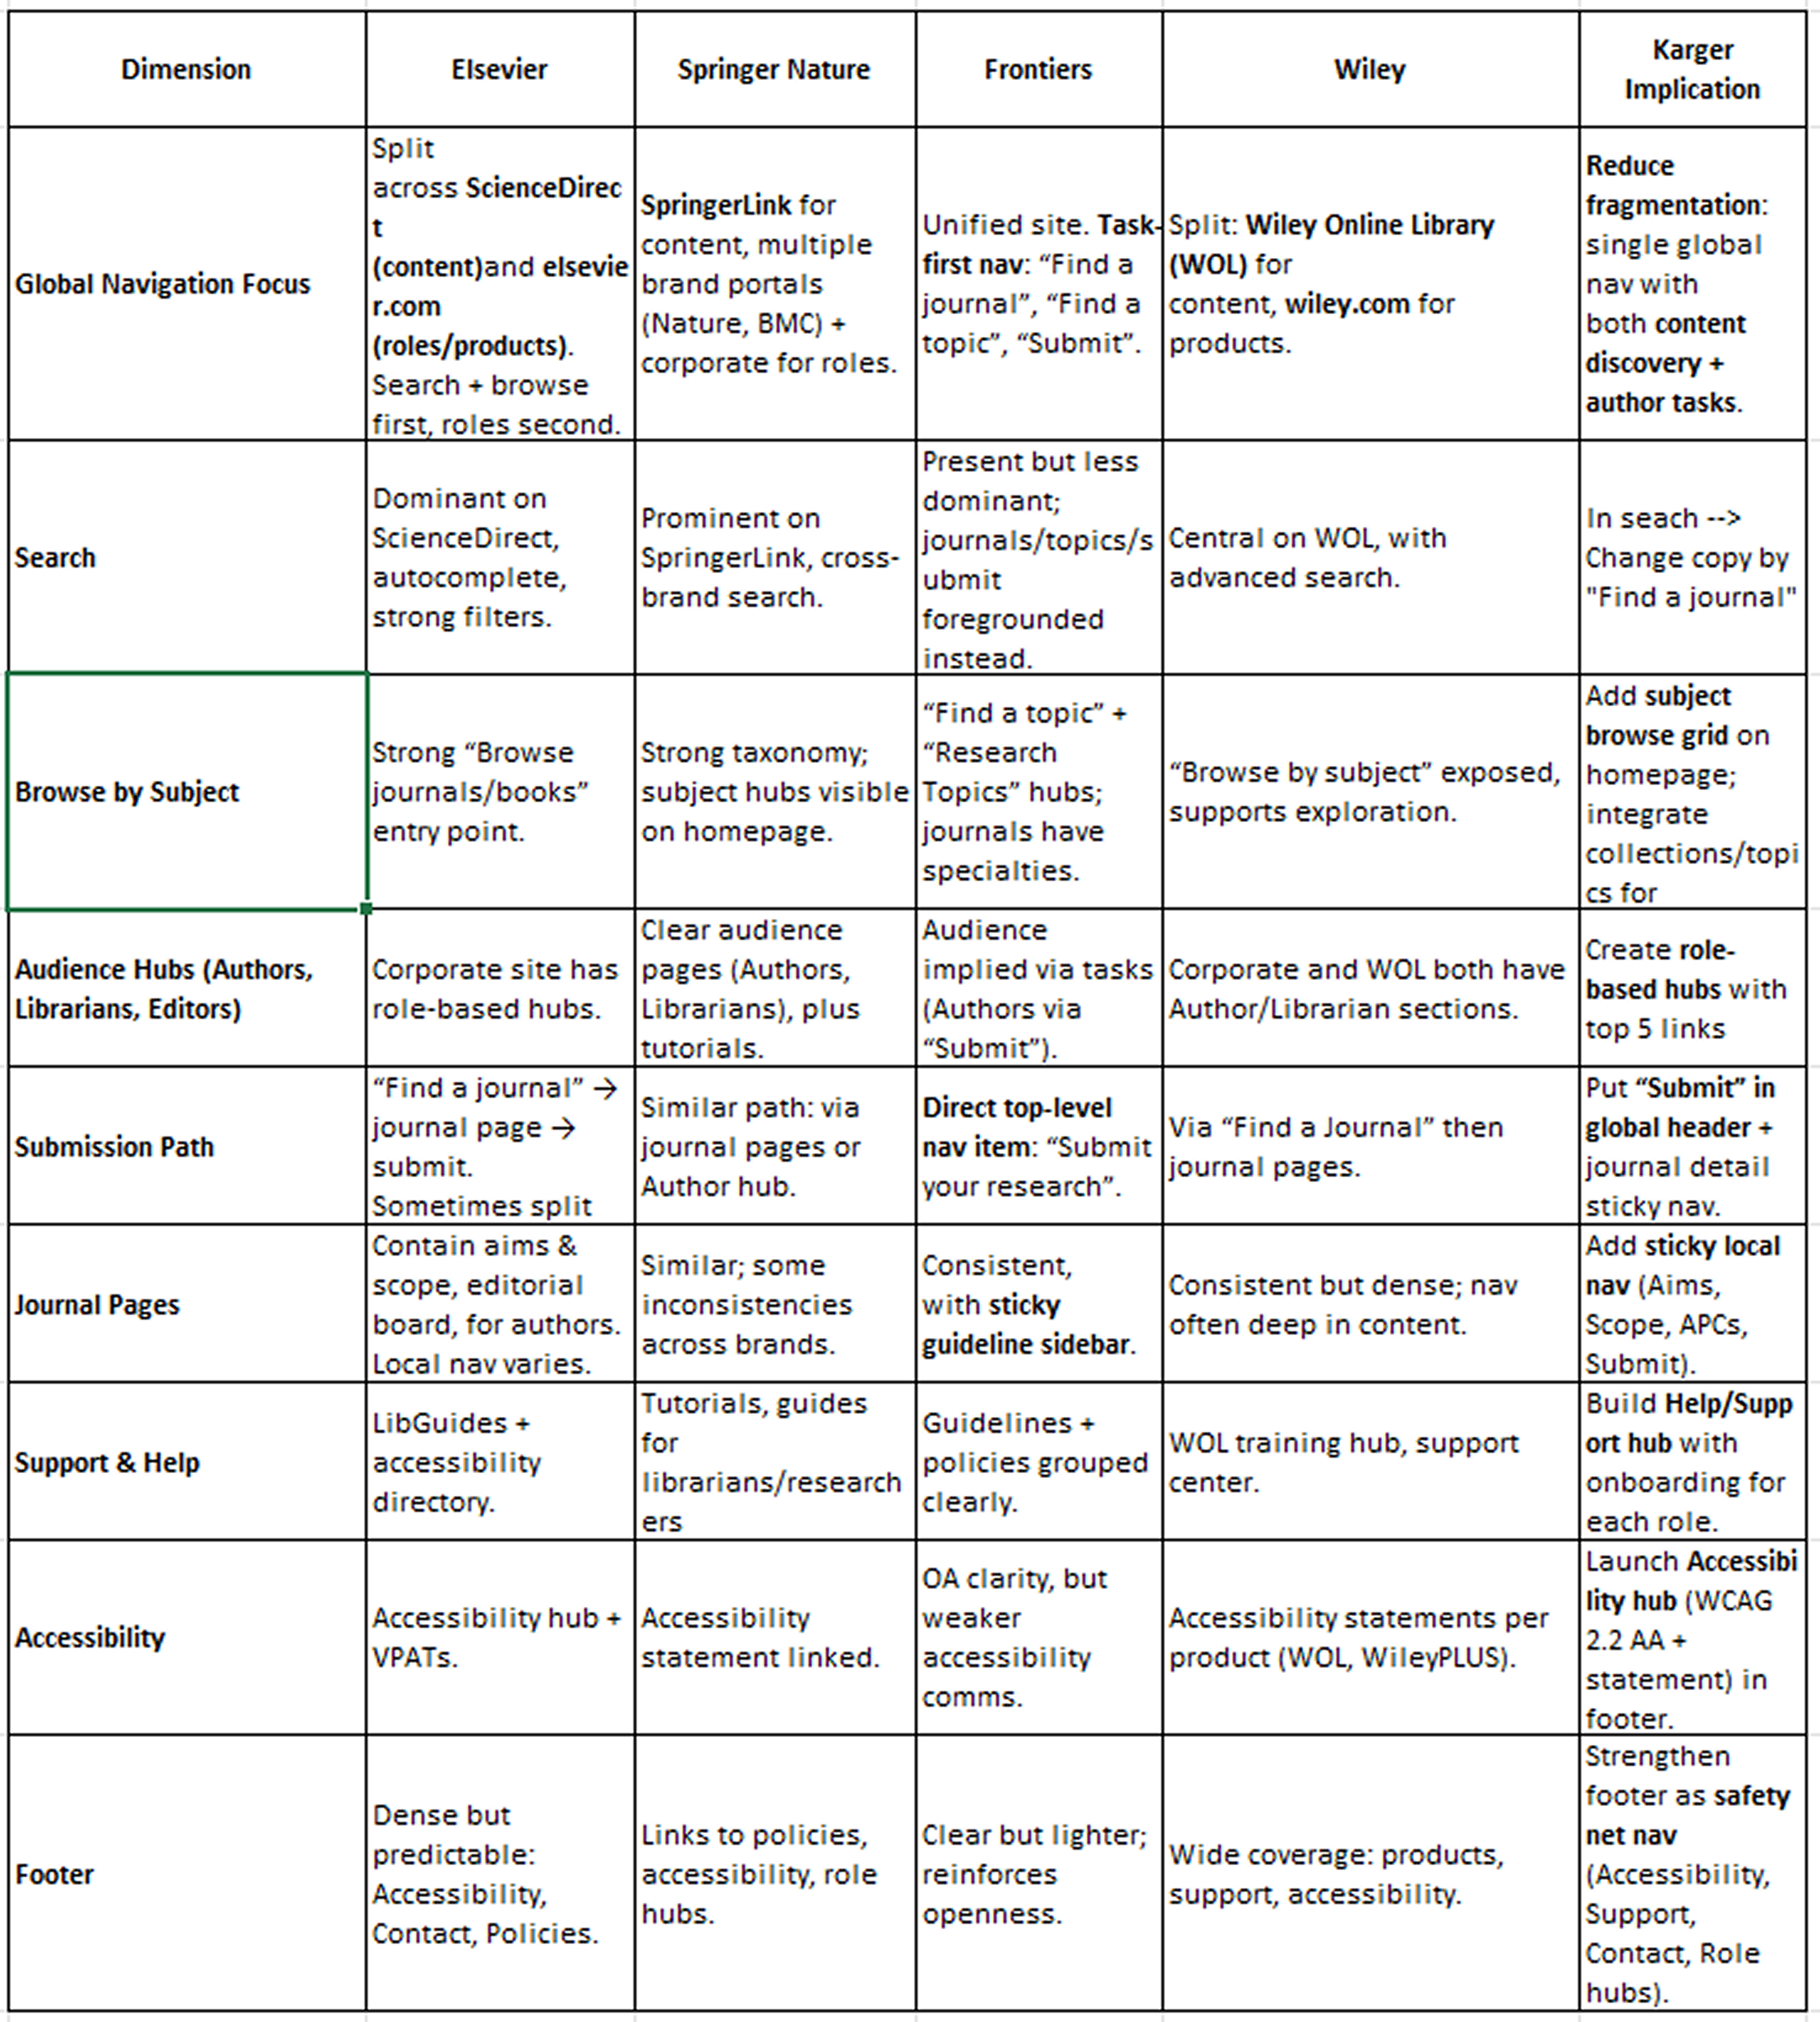
Two patterns emerged consistently among best-in-class competitors. The first was clear role-based entry points: distinct, visible pathways for different audience types rather than one-size-fits-all navigation. The second was task-first navigation, where submission and discovery paths were surfaced immediately rather than buried in sub-menus.
These became the structural principles guiding the redesign, alongside a move toward consolidated audience hubs rather than scattered audience-specific pages.
Step 3: A New Navigation Architecture — First Draft
The research fed directly into a first-draft navigation structure that reorganized the site around five core pillars: Home, Publish With Us, Our Offers, About Karger, and Insights, with a persistent "Publish Your Paper" CTA elevated to global navigation. The home page was redesigned to function as an orientation layer, highlighting key audiences and driving users toward the site's most strategic content rather than acting as a standard navigation item.
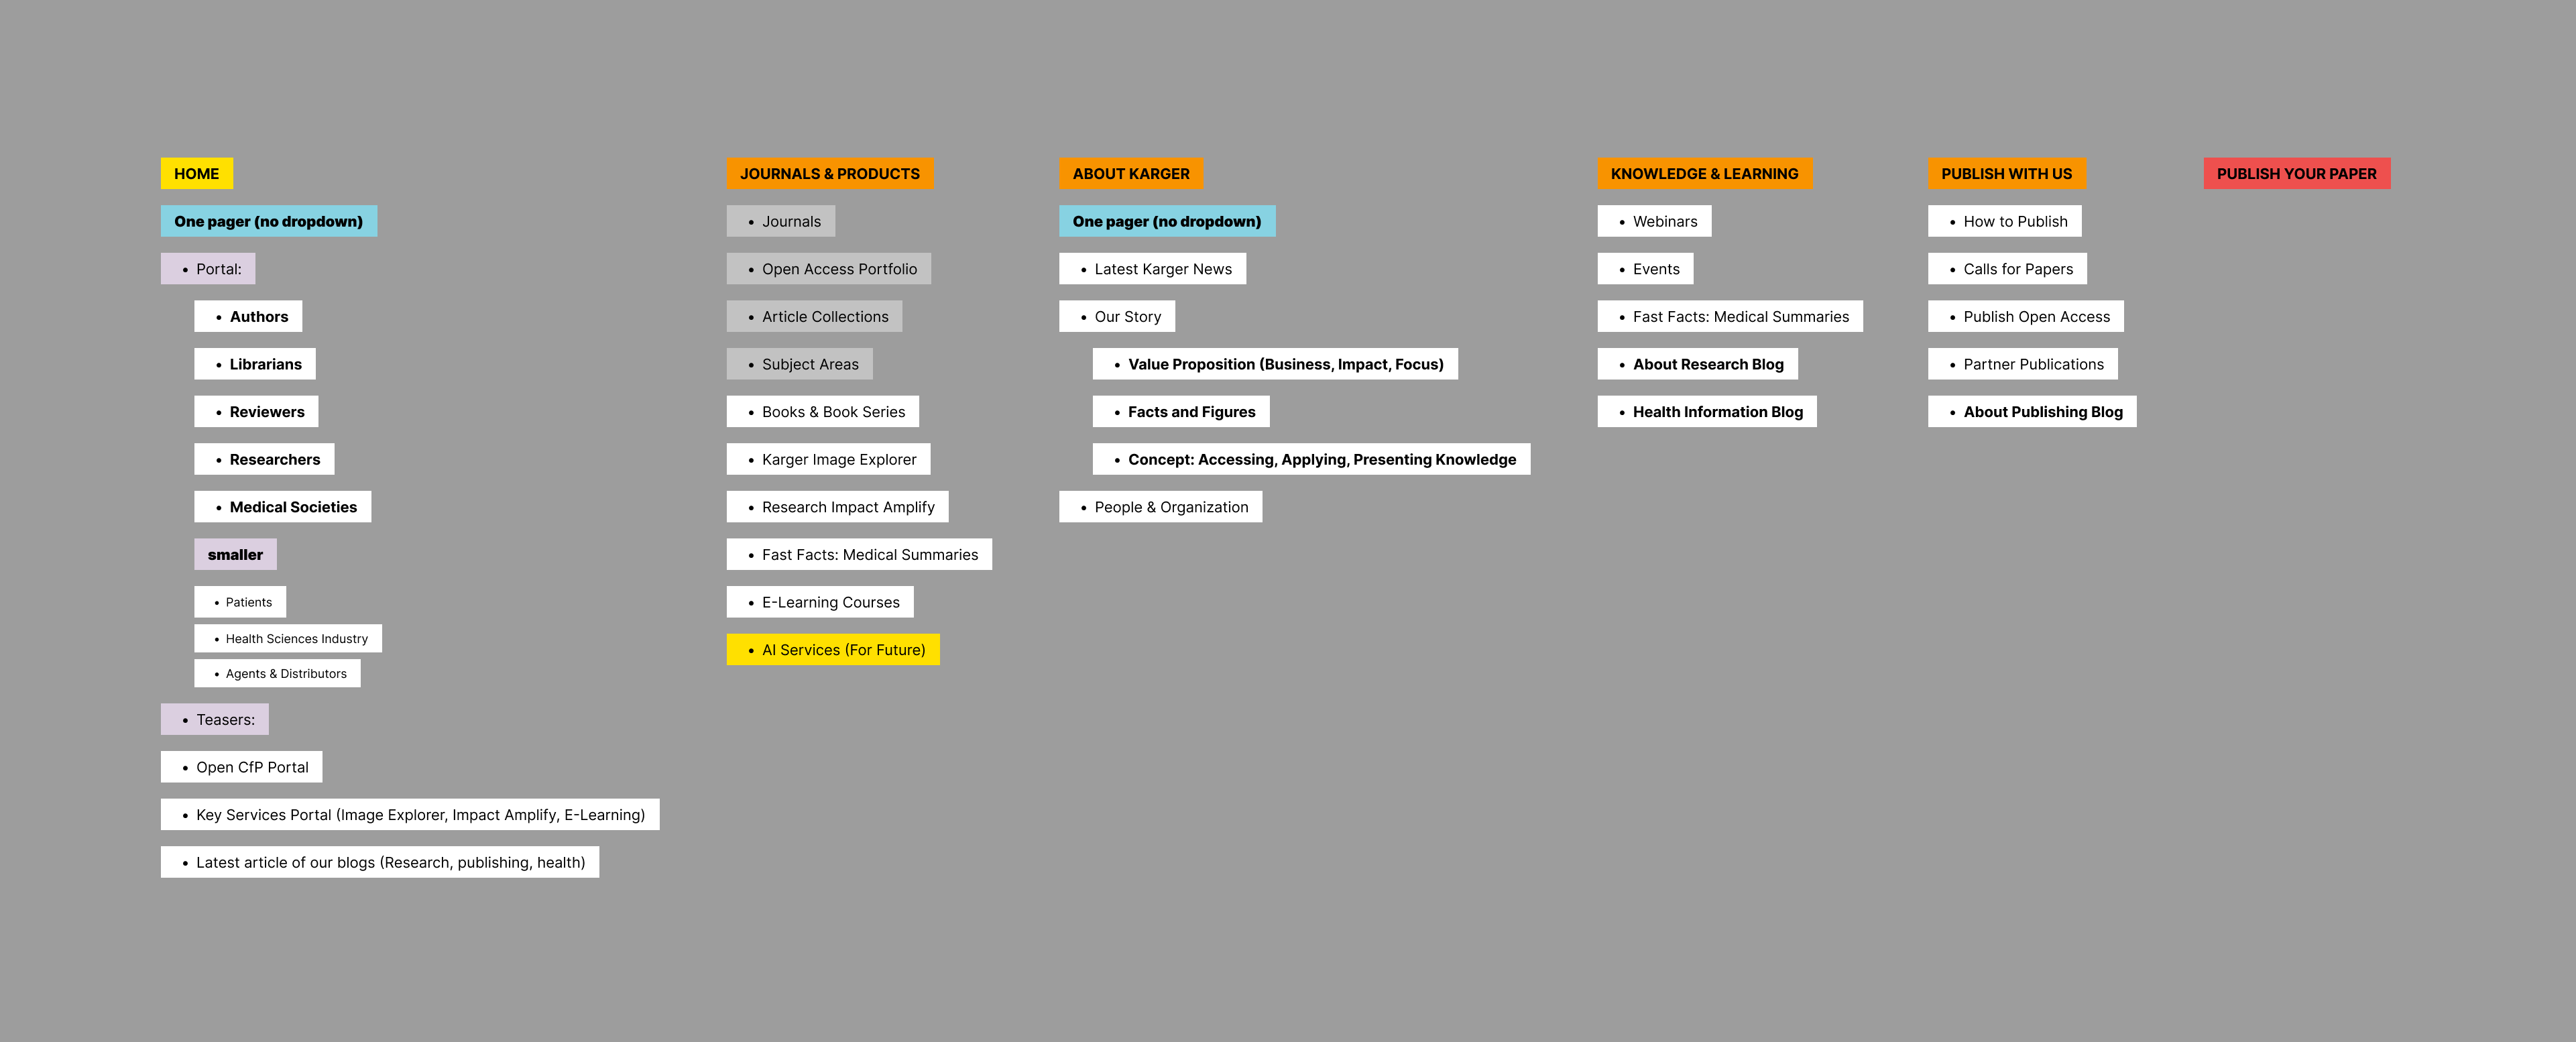
But a first draft is a hypothesis, not a solution. The next step was to test whether this structure actually matched how users think.
Step 4: Card Sorting to Validate the Architecture
I ran an open card sort designed in two parts on Lyssna with 60 participants and 30 cards. The first task was an open card sorting and I asked participants to sort concepts freely to uncover natural naming patterns that could inform navigation labels. The second task was this time a closed card sorting, and I asked the participants to sort content into our proposed structure. I wanted to validate whether our five pillars aligned with their mental models.
The results gave us both confidence and useful corrections.
Some items showed strong, unambiguous consensus. "Karger News" landed under "About Karger" for 100% of participants. "How to Publish" (100%) and "Publish Open Access" (85%) both went firmly under "Publish With Us." On the Home side, "Patients" (85%), "Researchers" (69%), and "Librarians" (62%) all grouped there consistently, directly validating our decision to make the homepage an audience orientation layer.
"Authors" told a more nuanced story. With 46% placing them under Home and 38% under "Publish With Us," the split revealed that users see Authors as both an audience type and a task-driven user with a specific job to do. Combined with GA4 data showing authors dominate site traffic, this pointed to a design decision: Authors needed both a visible entry point on the homepage and a direct, task-first path into the publishing journey.
The open card sorting got interesting as well. Participants agreed on the mental model but not the terms and to give an example "Webinars" generated 33 different category names, most meaning the same thing: Education, Learning, Educational Resources...
A few cards revealed genuine tension worth making an explicit design decision about. "E-learning Courses" split almost evenly between Insights (46%) and Our Offers (54%): is it content or a product? "Karger Image Explorer" leaned toward About Karger (54%), suggesting users perceive it as a company tool rather than a content resource. These cases required a deliberate positioning call from the team.
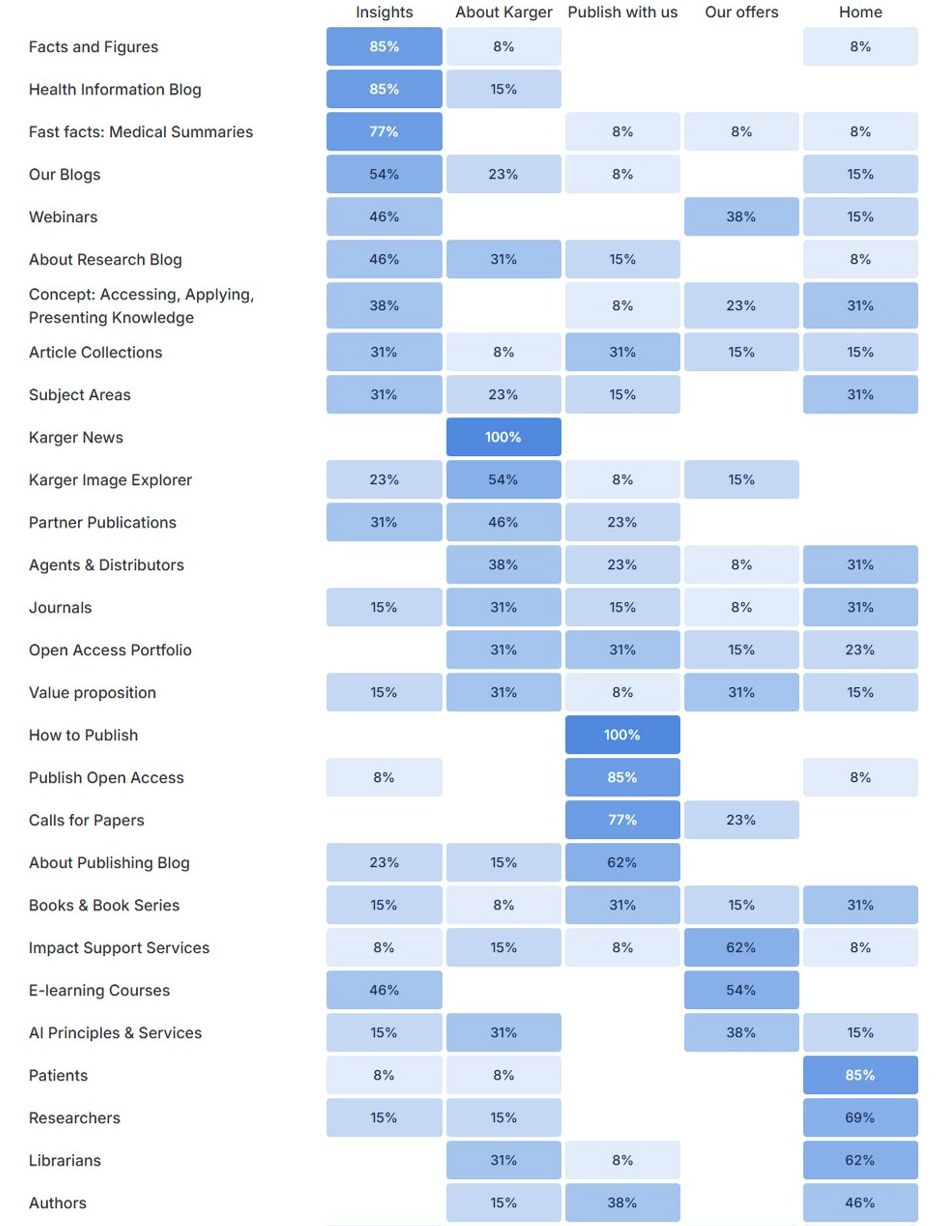
Based on these findings, I refined the architecture into a high-level information structure ready for implementation.
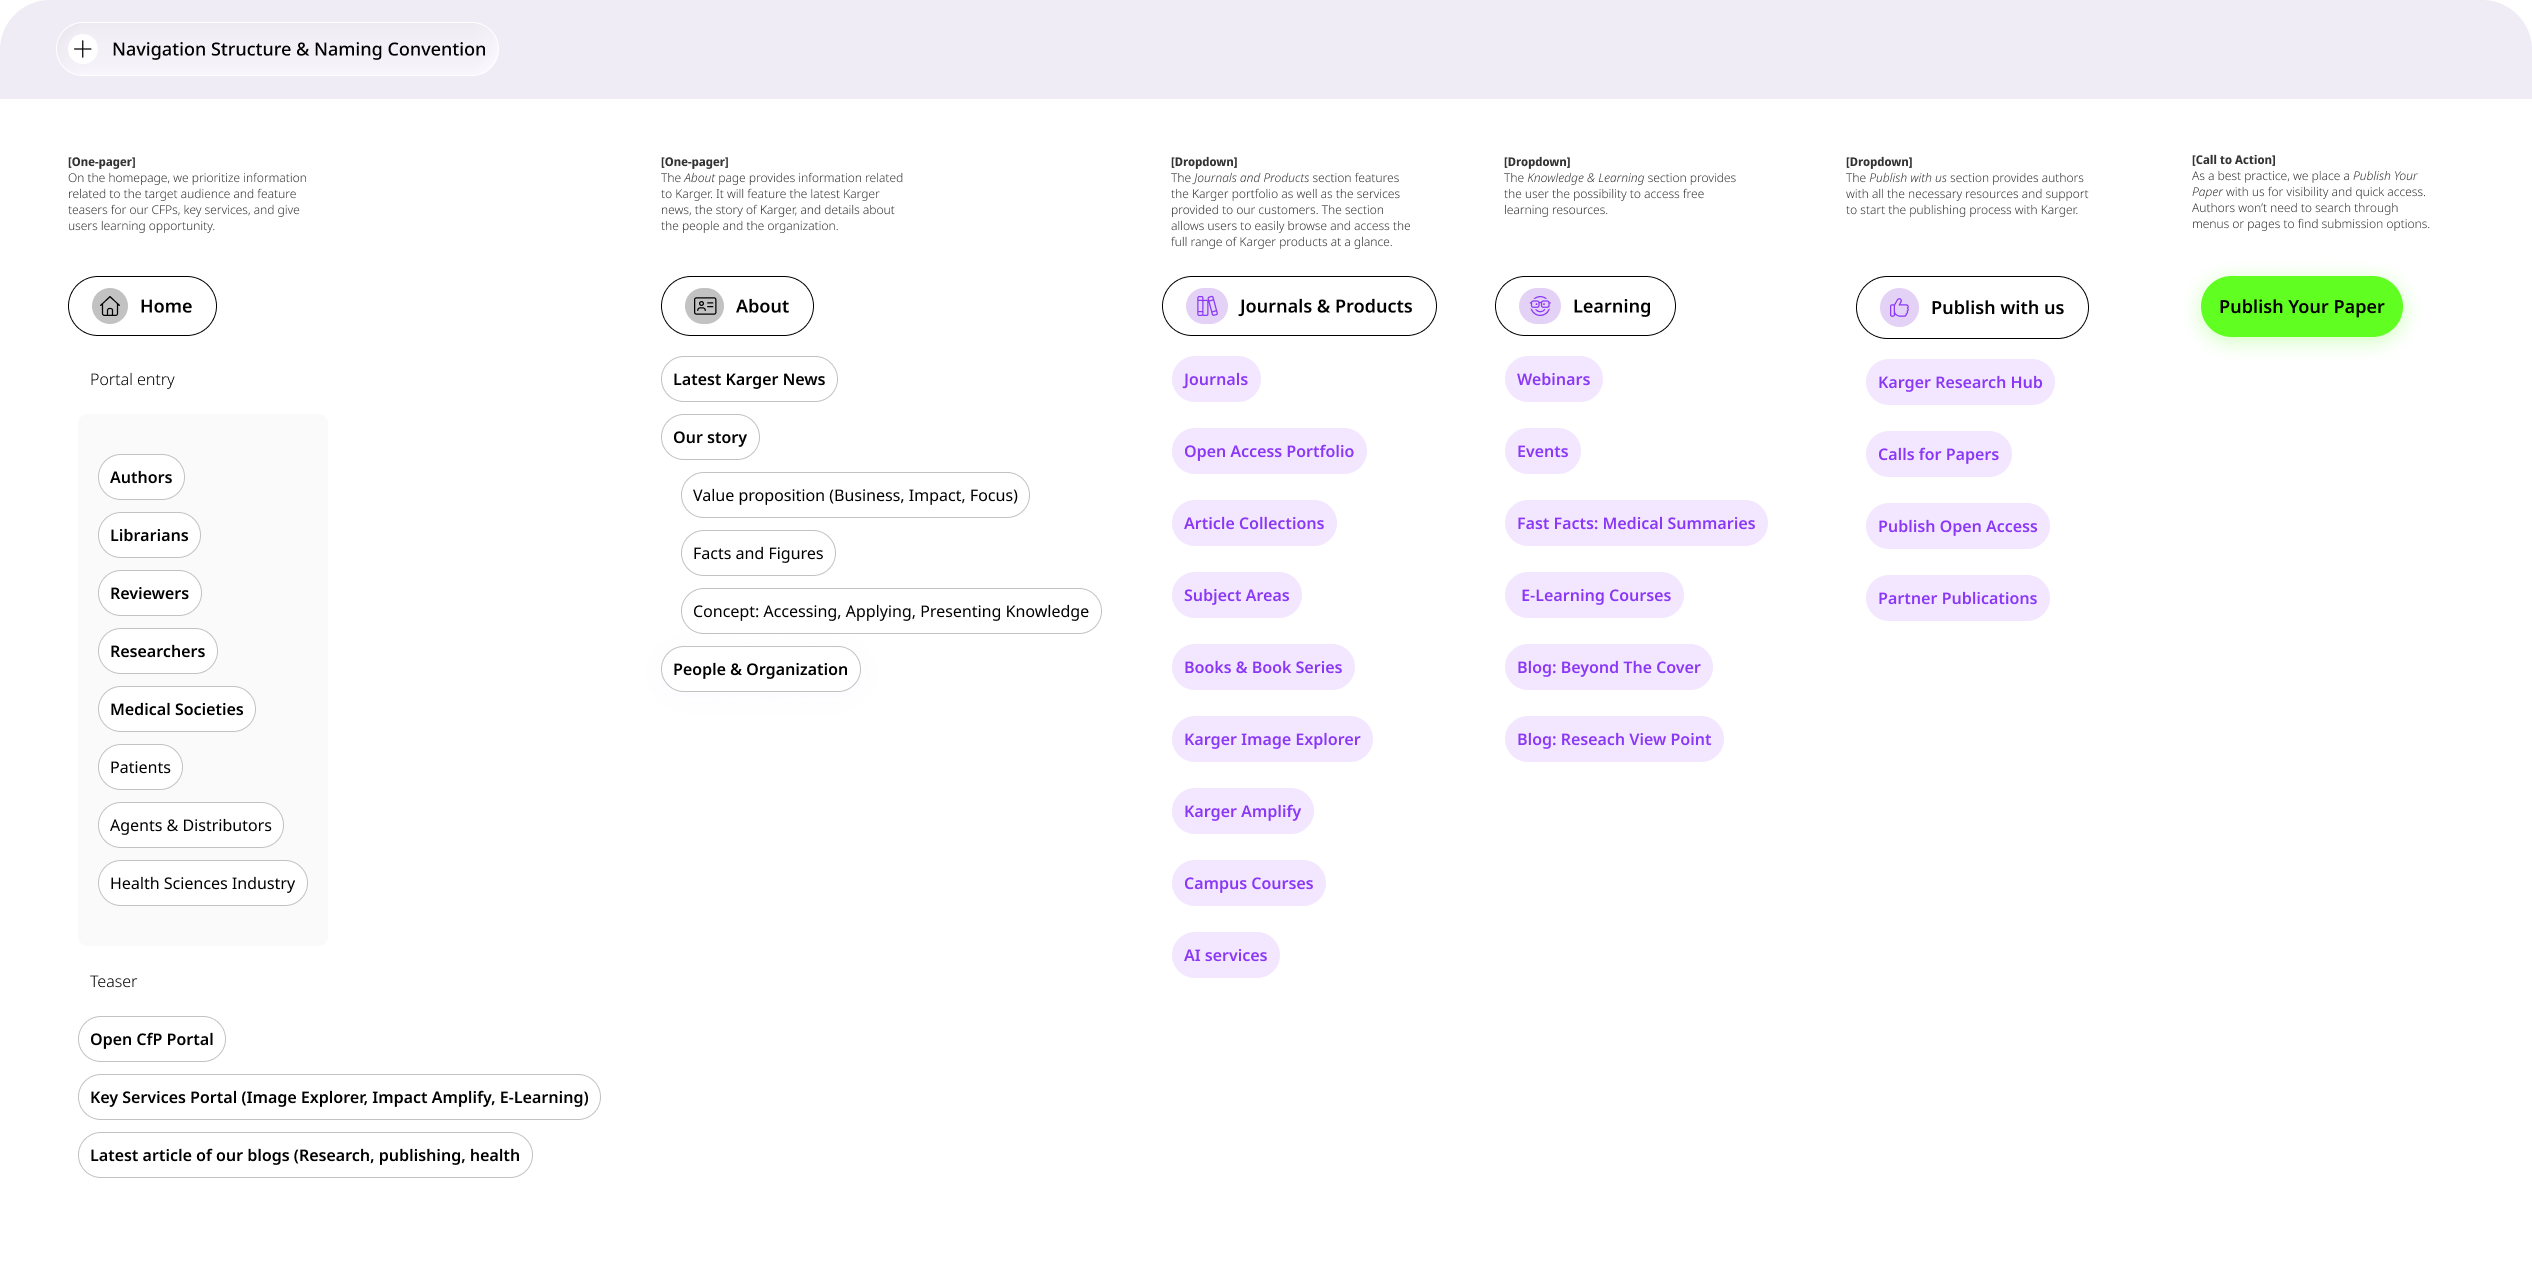
Step 5: Flattening the Sitemap
With the architecture validated, I turned to the existing page inventory. Using GA4 traffic data as a guide, I audited every page against the new structure, removing underperforming pages, merging redundant ones, and repositioning high-value content that had been buried.
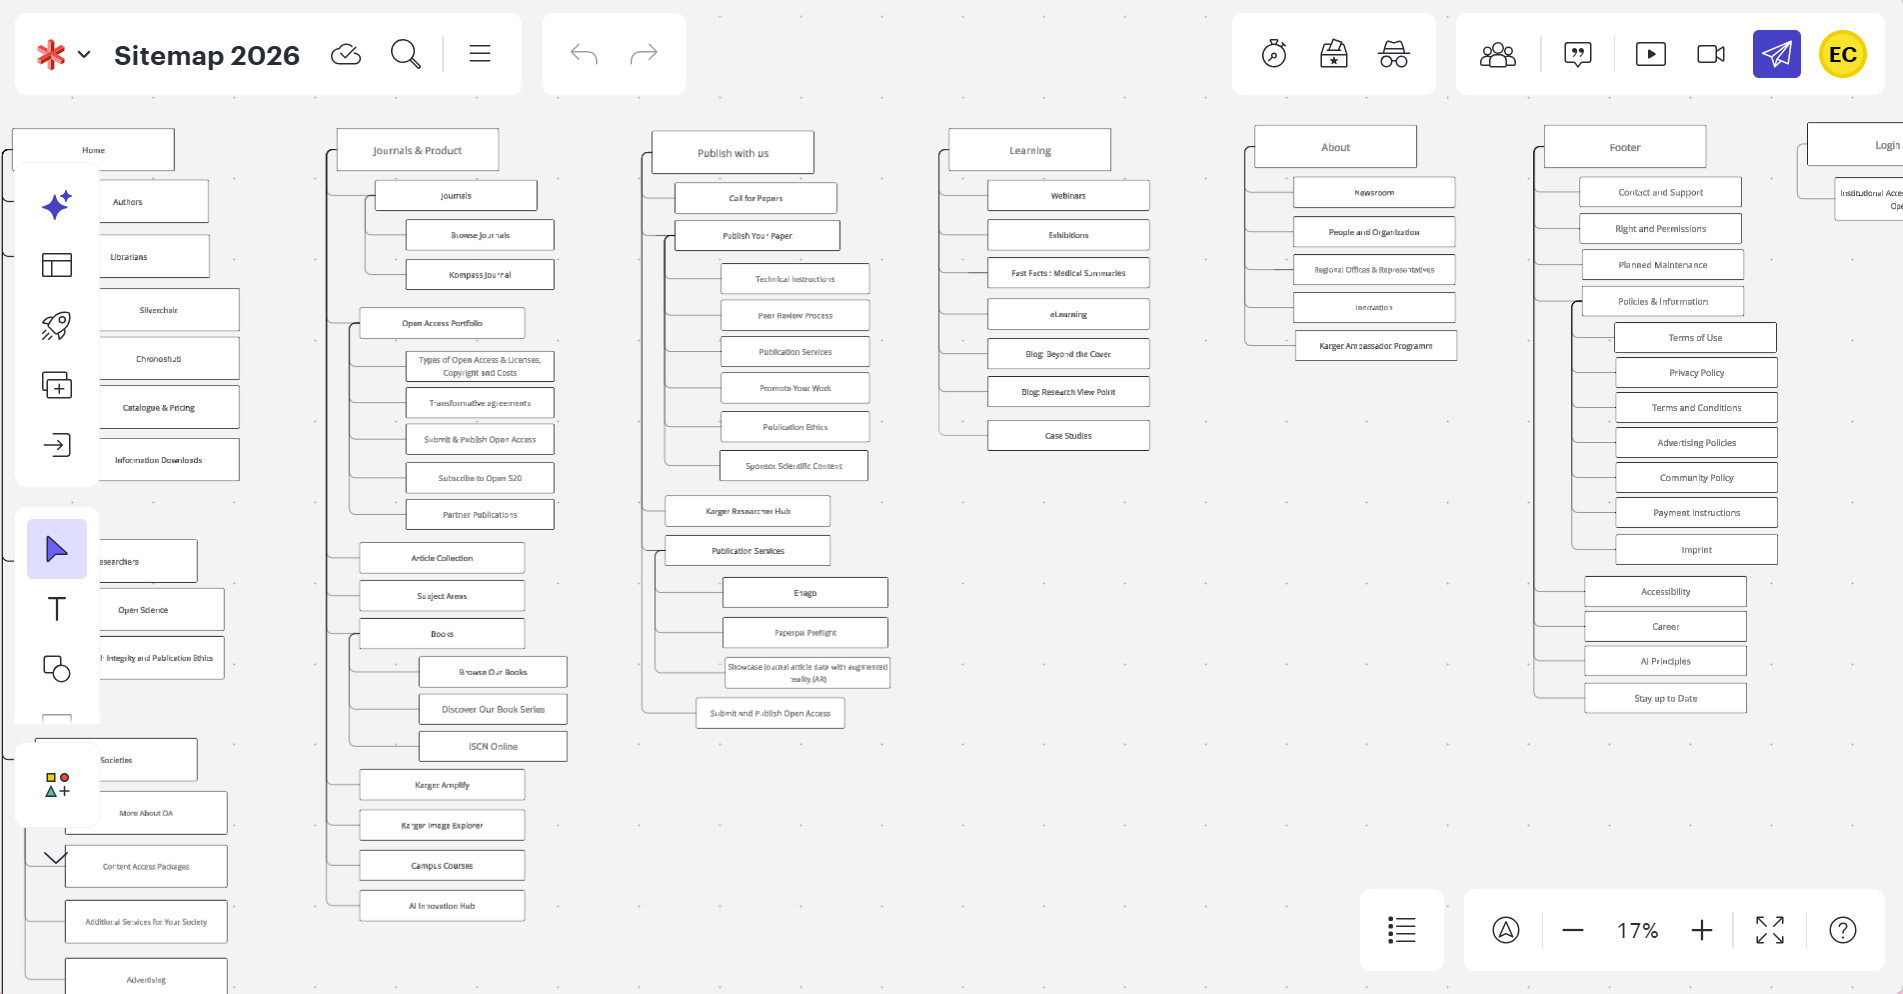
The result was a leaner, more intentional sitemap where every page earned its place based on user behavior and strategic value.
Next: New Design
The validated architecture and flattened sitemap are now ready to inform the next phase: translating the new structure into a redesigned navigation and page layout.